Turning spreadsheets into stories: How two companies uncovered the gold in their fleet data
March 28, 2022Fleet data almost always tells a story, but it’s not always obvious what it is. Usually, it takes extra effort and time to pinpoint the narratives to make the data more relevant, meaningful, and most importantly, actionable.

Collecting fleet data has become a significantly more achievable and affordable task these days. The real challenge is extracting the right insights from your data via fleet analytics to improve your fleet’s overall performance and manage costs. That’s the gold to be mined. But what’s the best way to do that? We suggest following the example set by Steven Levitt, co-author of the mega-seller Freakonomics, who said of his approach, “I take a huge pile of data, and I try to get it to tell stories.”
Fleet data almost always tells a story, but it’s not always obvious what it is. Usually, it takes extra effort and time to pinpoint the narratives to make the data more relevant, meaningful, and most importantly, actionable.
“My goal for all the data that I share with my clients is to make it actionable,” said Brent Pietroski, Client Partnership Manager. “I don’t want to show them something and then just tell them that their costs are high. If we can really identify what the root cause is of some of these cost increases, then we can make adjustments and ultimately work to help avoid them.”
To find the best stories in your data, begin with what you believe is the key question you need answered. Then follow the data closely to see where it leads you; that’s when the most impactful stories take shape. Here are two maintenance-related examples based on real-world fleets. To protect the companies’ identities, let’s call them “Company A” and “Company B.”
Company A’s issue: “Why aren’t our newer vehicles lowering our maintenance costs?”
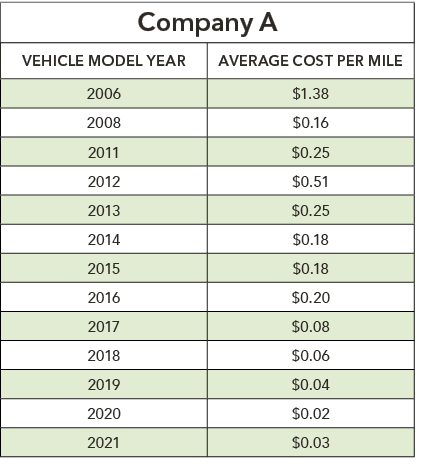
Company A, with a 150-vehicle fleet in the commercial refrigeration business, noticed that despite the significant addition of newer model vehicles, their overall fleet vehicle maintenance costs were increasing. This finding was counterintuitive and unexpected. From a more nuanced evaluation of the data, a narrative emerged that shed light on the situation—and suggested solutions.
First, an examination of the company’s maintenance costs on a per-mile basis showed their newer model vehicles were, indeed, incurring much lower fleet costs than their older models—just as one would expect.
With a deeper data dive, more revealing—and unsettling—details were uncovered. In comparing 2021 to previous years, Company A’s average monthly maintenance costs were up dramatically in some cases. Here are a few examples:
- Labor expenses up 41%
- Parts expenses up 54%
- Steering and suspension expenses up 55%
- Brake expenses up 73%
- Tune-up expenses up 95%
“The conversation quickly flipped from, ‘Why aren’t our new vehicles performing the way that they should be and reducing our costs,’ to ‘So we need to get into newer vehicles to help reduce these costs even more,’” added Pietroski.
While some expense increases were due to global supply chain issues beyond Company A’s control, other rising costs could be addressed. For instance, the steep spike in their brake expenses was reversed through a scoring and analysis of each driver’s braking techniques. In addition, Company A reevaluated their brake components to ensure each vehicle had the most appropriate ones installed based on the vehicle’s specific payload and other attributes.
Company B’s issue: “Why are our maintenance costs going through the roof?”
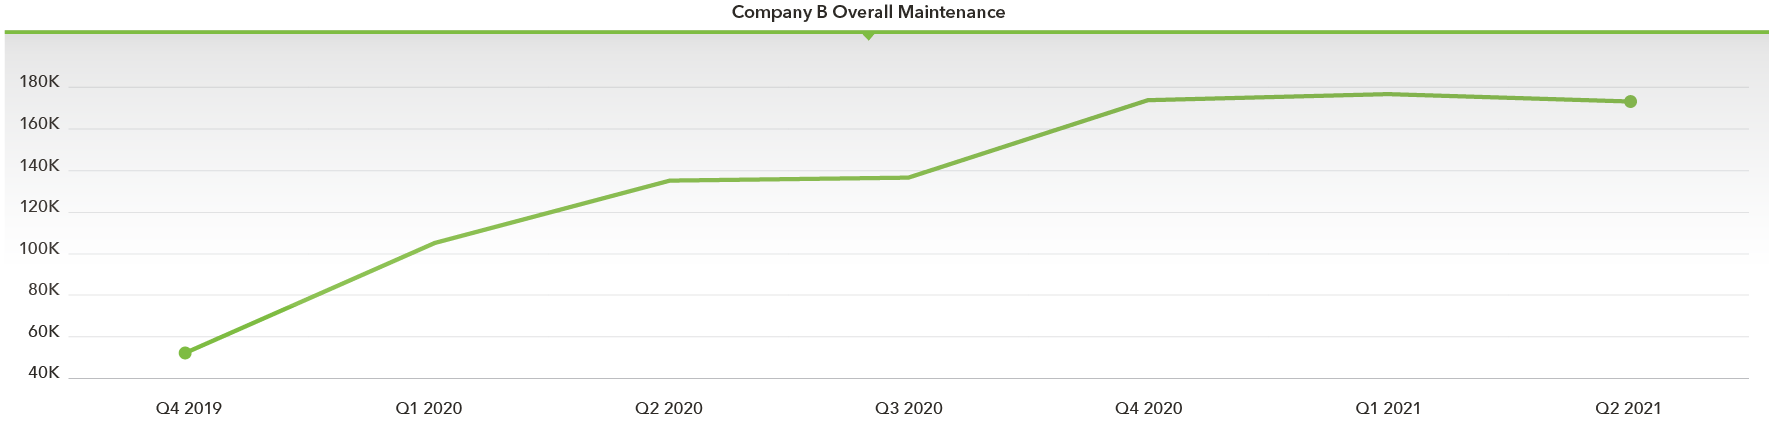
Like Company A, Company B noticed an increase in their overall maintenance expenses and wanted to know why. Company B, a health care business, operates a 500-vehicle fleet made up mostly of sedans and SUVs. Their vehicles endure considerable wear and tear because they’re driven multiple shifts per day.
A review of their data showed overall maintenance costs remained flat—with one significant and startling exception. Their transmission expenses in one quarter rose a staggering 853%. To understand the story behind this alarming increase, it was necessary to view the transmission data at the vehicle level.
![]()
It was quickly determined that three specific models, from two different manufacturers, were responsible for virtually all their skyrocketing transmission costs. “By looking at their maintenance expenses from an individual category level, we were able to provide them with peace of mind by knowing which areas of maintenance were costing more and acting as outliers,” added Brent.
Company B is using these insights to evaluate what vehicle adjustments to make in the short- and long-term based on this new understanding of true costs associated with the three offending models.
What stories are your fleet data telling you?
To get the most from your fleet data, invest the time to not only review the macro trends, but discover the micro ones too. This is where the various data sets interact with one another and often reveal interesting tales. You might find it helpful to reach out to an outside authority to help with your analysis. In either event, you can then craft a plan to ensure the story leads to a happy ending for your fleet and your organizatio
Skills covered in the class
Data-Driven Decision Making
Operational Efficiency
Financial Management
Optimal Vehicle Health
Did you enjoy this class?
Share it with your organization and colleagues.